• HOME
  • MARKETS
  • ANALYSIS
  • SIGN UP
No Result
View All Result
FTD Limited
  • HOME
  • MARKETS
  • ANALYSIS
  • SIGN UP
No Result
View All Result
FTD Limited
No Result
View All Result

An AUDNZD Strategy With a Success Rate of 75 Percent is Close to Give a New Signal

Burc Oran by Burc Oran
January 13, 2021
Reading Time: 2 mins read
A A
An AUDNZD Strategy With a Success Rate of 75 Percent is Close to Give a New Signal
0
SHARES
59
VIEWS
tweetpostshare
Share us on social media
AUDNZD Daily Chart, RMI(14-10), RSI(14)
AUDNZD Daily Chart, Z-Score(50) with plus-minus 2 Standard Deviations

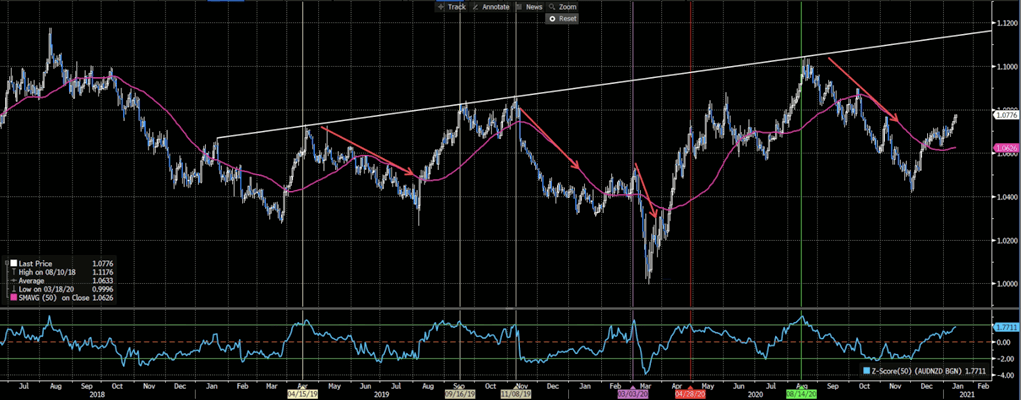
AUDNZD’s overall price range has been extending since 2018. Downward reversals usually get nearly clear signals from multiple indicators. First RSI reverses from the overbought zone then sometime later its distant cousin RMI indicator crosses its own 10-day moving to the downside when RMI still over 70. This strategy signaled 5 times in the last 2 years and it worked 4 times. The fifth one did not work but later formed a double top with the same signal so we can even count that too.

Another good signal came from the 50-day moving average and its z-score. Reversal from the over 2-standard deviation zones creates 6 signals with a %66,6 success rate. One of the two incorrect signals was the same one cause double top, if we count that too rate jumps to %83,3.

AUDNZD Daily Chart, Z-Score(50) with plus-minus 2 Standard Deviations

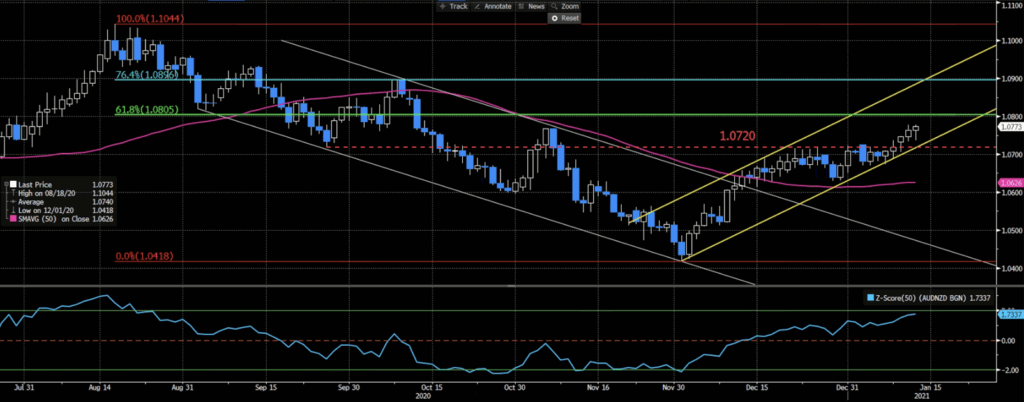
So, why are we blubbering about these indicator signals? Well, all three of them are nearing critical zones. RMI is over 80 already and its 10-day moving average is fast approaching. RSI is flirting with 70, the overbought line, and Z-Score is at 1.73 nearing the 2 standard deviation line. When 3 of these indicators signaled in the last 2 years, the success rate was %75 and AUDNZD fell with an average of %6. If the price continues to surge in the coming days indicators will get ready to shoot their sell signals. But until then the price may continue its surge within the bullish trend channel to at least %61.8 and %76.4 Fibonacci levels of the last down move.

Learn more about us

Şununla paylaş:

  • Facebook
  • X (Twitter)
  • LinkedIn
  • Daha fazla
Tags: AUDNZDForexforex trading
TweetShareShareSend
Previous Post

Wednesday, January 13, 2021 Headlines

Next Post

Thursday, January 14, 2021 Headlines

Related Posts

COT Weekly Non-Commercial Net Positions
MARKETS

COT Weekly Non-Commercial Net Positions

EURUSD Under Heavy Pressure from Long-Term Resistance and Bearish Formation 
MARKETS

EURUSD Under Heavy Pressure from Long-Term Resistance and Bearish Formation 

Silver Forms Double Top, Testing Key Support for Potential Downward Move 
MARKETS

Silver Forms Double Top, Testing Key Support for Potential Downward Move 

COT Weekly Non-Commercial Net Positions
MARKETS

COT Weekly Non-Commercial Net Positions

Bullish Yen Bets Hit by Ishiba’s Surprise, USDJPY Reacts Upward 
MARKETS

Bullish Yen Bets Hit by Ishiba’s Surprise, USDJPY Reacts Upward 

Dollar Tests Long-Term Support Ahead of the Most Uncertain FOMC Meeting of the Year  
MARKETS

Dollar Tests Long-Term Support Ahead of the Most Uncertain FOMC Meeting of the Year  

Next Post
Trump lifts travel ban to some countries; Moderna allergy outbreak in California: vaccine banned; Samsung CEO sentenced to 30 months in prison for corruption

Thursday, January 14, 2021 Headlines

You might also like

What is MACD and How to Use it Effectively?

What is MACD and How to Use it Effectively?

Unveiling the Tapestry of Trading: Insights into Market Participants

Unveiling the Tapestry of Trading: Insights into Market Participants

Dynamics of Fiscal and Monetary Policies in Multi-Asset Strategy

Dynamics of Fiscal and Monetary Policies in Multi-Asset Strategy

Bitcoin Holds onto Key Support After Last Week’s Plunge

Bitcoin Holds onto Key Support After Last Week’s Plunge

Beyond the Technical: The Power of Trading Psychology

Beyond the Technical: The Power of Trading Psychology

How to Know When You’re Ready to Switch to Live Trading?

How to Know When You’re Ready to Switch to Live Trading?

Recent Posts

  • COT Weekly Non-Commercial Net Positions
  • EURUSD Under Heavy Pressure from Long-Term Resistance and Bearish Formation 
  • Silver Forms Double Top, Testing Key Support for Potential Downward Move 
  • Monthly Market Outlook
  • COT Weekly Non-Commercial Net Positions
FTD Limited

The content of the site is presented for informational purposes only not to give any investment advice which mainly focuses on financial instruments such as Forex, Spot Metals, CFDs, and Indices.

MENU

  • HOME
  • MARKETS
  • ANALYSIS
  • SIGN UP

Latest Articles

  • COT Weekly Non-Commercial Net Positions
  • EURUSD Under Heavy Pressure from Long-Term Resistance and Bearish Formation 
  • Silver Forms Double Top, Testing Key Support for Potential Downward Move 

Subscribe to our newsletter and get notified about the next update.

    © 2021 FTD Limited

    FTD Articles is a website prepared by FTD Limited's research team. FTD Limited is an online brokerage company offering products of Forex, Spot Metals and CFDs.

    The ideas and the information shown here have no responsibility of any of the trading decisions made by the investors or the visitors of this site. Therefore, under no circumstances will FTD Limited nor FTD Articles be held responsible or liable in any way for any claims, damages, losses, costs or liabilities resulting or arising directly or indirectly from the use of website content. We recommend that you seek advice if you have not involved with trading before in order to prevent potential risks that may arise.

    No Result
    View All Result
    • HOME
    • MARKETS
    • ANALYSIS
    • SIGN UP

    © 2021 FTD Limited

    FTD Articles is a website prepared by FTD Limited's research team. FTD Limited is an online brokerage company offering products of Forex, Spot Metals and CFDs.

    The ideas and the information shown here have no responsibility of any of the trading decisions made by the investors or the visitors of this site. Therefore, under no circumstances will FTD Limited nor FTD Articles be held responsible or liable in any way for any claims, damages, losses, costs or liabilities resulting or arising directly or indirectly from the use of website content. We recommend that you seek advice if you have not involved with trading before in order to prevent potential risks that may arise.

    Welcome Back!

    Login to your account below

    Forgotten Password?

    Retrieve your password

    Please enter your username or email address to reset your password.

    Log In
    This website uses cookies. By continuing to use this website you are giving consent to cookies being used. Visit our Privacy and Cookie Policy.
    • Facebook
    • X (Twitter)
    • LinkedIn
    • More Networks
    Share via
    Facebook
    X (Twitter)
    LinkedIn
    Mix
    Email
    Print
    Copy Link
    Copy link
    CopyCopied